Monitoring Water Flow
Onset Monitoring Flow With Water Level Loggers
One of the challenges that are currently faced by irrigation organisations and individual farms is the accurate monitoring and recording of irrigation water usage in open-channel applications. By using the HOBO Bluetooth (BLE) water level logger to record water depth, we can use the data collected to calculate flow rates and water usage in a variety of open channel applications. A flume is used to measure flow accurately in an open ditch by forcing the flow of water into a certain upstream and downstream water level, creating a known velocity to be used in the calculation of flow rate based on the area of the flume. A weir is another measuring device that requires more upstream freeboard and often cannot be used as effectively as a flume.
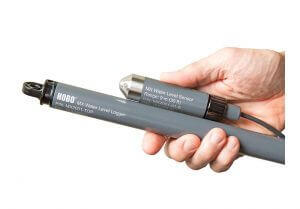
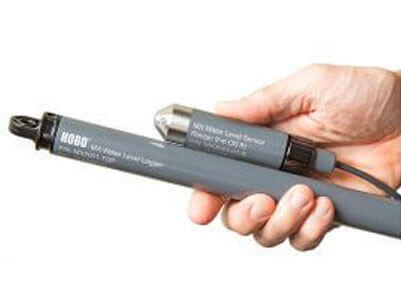
Deploying of bluetooth hobo water level data logger
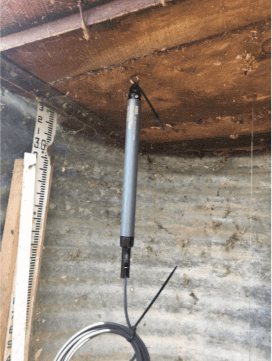
To measure the water in the stilling wells, the HOBO MX2001s were installed by fastening the logger to an eye-hole screw attached to the underside of the wooden shelf in each stilling well.
Using Bluetooth Low Energy (BLE) technology, the MX2001 communicates to a mobile device (smart phone or tablet) via the free HOBOmobile® app, which is available for either Apple or Android products. Bluetooth communication proved to be very convenient, as one simply had to be within a dozen feet or so of a stilling well to collect the data wirelessly, without having to open the well.
It also allowed for checking the accurate real-time water level to compare to the visual staff gauge in the canal.
Site setup and data collection
Once the HOBO MX2001s were deployed, the HOBOmobile app was used to set up each site and calibrate the water level reading with an offset to match the visual reading of the water level in the canal, flume, or weir. The offset makes it so that the water level that’s recorded is the actual water level needed for calculating the flow rate. Since it’s nearly impossible to set the sensor at the exact zero location in the water column, this is a very important
feature.
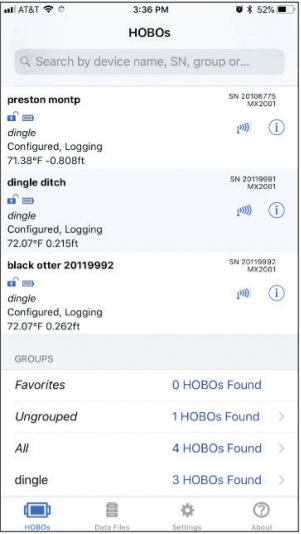
When your smart phone or tablet is near one of the loggers, the logger automatically appears in the app, as shown on the left. You can see that the logger is configured and that it’s logging. The recent water level reading and battery status are also displayed.
It’s easy to connect to a site; simply tap on the name of the station (the name given when setting up the site for the first time). Once connected, you’ll see a screen like the one on the bottom.
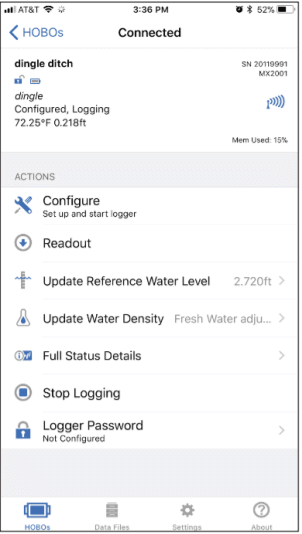
To configure the logger, simply tap on Configure and you’ll see a screen that allows you to name the site, record the GPS location(if desired), and calibrate the water level by entering the actual depth of water into the Reference Water Level. Under Logging Setup, enter the frequency of the logging interval – that is, the time between records in the data file (for example, hourly).
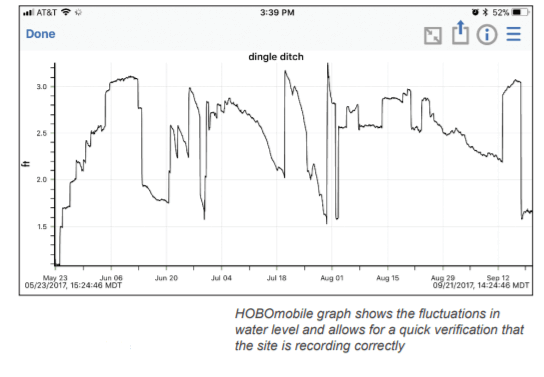
Collecting data is simple. Once connected to the station, tap the Readout menu item as displayed on the Connected screen. Once the data file is connected to the phone or tablet, you’ll see a screen showing a graph of the data.
The graph shows the fluctuations in water level and allows for a quick verification that the site is recording correctly. You can easily export the data by clicking the Share icon. You can email the data to yourself, or upload to a cloud drive like Google Drive or Dropbox. You can export the data in an Excel compatible file format or in a HOBO file to be opened in HOBOware on your computer.
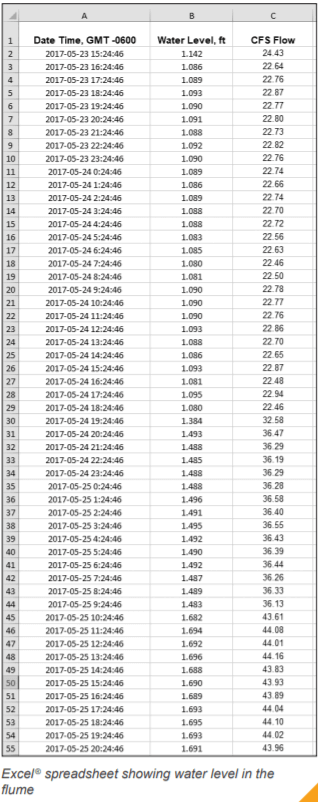
Below is an example of a data file that we opened in Excel and then applied the flow formula to the water level data from the HOBO MX2001. We were able to create a spreadsheet showing the water level in the flume, weir, or rated section and then add the formula to calculate the flow rate in CFS.
This is the water level data from the site that’s a rated section of the box culvert.
We used the polynomial formula that was created by making manual flow readings at different depths in the channel. Then, by taking an hourly reading of water level, we can have a data file that shows an hourly flow rate at that location.
This is the same process to create a data file for the sites with the Parshall flume and the weir. By using the water level from theHOBO MX2001 loggers and the mathematical formula for those primary measuring devices, we created data files showing the hourly flow rates for those canals. With this data, it’s also possible to calculate acre-feet used over time – which is useful for billing for water usage or for regulating usage amongst water users.